 English
 Spanish
 Russian
 Ukrainian
 Korean
 Chinese
Train G Analytics
75
2,277
100%
Source: MTA Monthly Ridership & Traffic Data (2019+). Hover the chart to inspect monthly totals by agency.
Annual totals by agency from 2019. Partial years include only months with published MTA data.
| Service | 2019 | 2020 | 2021 | 2022 | 2023 | 2024 | 2025 | 2026 |
|---|---|---|---|---|---|---|---|---|
|
Sub
NYC Subway
Subway
|
1,697,787,002 | 639,541,029 | 759,976,721 | 1,013,425,465 | 1,151,998,158 | 1,194,866,357 | 1,281,883,362 | 420,064,082 |
|
SIR
Staten Island Railway
SIR
|
4,300,490 | 1,425,632 | 1,467,734 | 2,009,154 | 2,229,659 | 2,298,867 | 2,344,427 | 774,783 |
|
MNR
Metro-North
MNR
|
84,980,378 | 26,576,540 | 30,102,081 | 47,959,450 | 59,126,927 | 66,293,851 | 70,289,927 | 22,350,068 |
|
LIRR
Long Island Rail Road
LIRR
|
91,105,138 | 30,310,191 | 35,036,745 | 52,540,523 | 65,238,830 | 75,510,389 | 81,969,404 | 26,137,992 |
|
Bus
NYCT Bus
NYCT Bus
|
557,036,504 | 208,847,049 | 311,893,589 | 343,092,962 | 340,766,398 | 323,904,716 | 352,146,093 | 103,907,702 |
|
Bus
MTA Bus
MTA Bus
|
120,431,976 | 45,920,802 | 71,431,467 | 82,609,385 | 86,216,666 | 85,129,056 | 90,075,077 | 27,269,330 |
|
BT
Bridges & Tunnels
BT
|
329,396,609 | 253,184,047 | 307,302,128 | 326,303,819 | 335,119,822 | 337,309,730 | 224,789,576 | — |
|
AAR
Access-A-Ride
AAR
|
10,918,218 | 7,117,061 | 7,812,888 | 9,153,604 | 11,065,559 | 13,310,590 | 15,670,457 | 5,214,133 |
All NYC trains


Analytics FAQ
What is the Reliability Score?
This is a real-time health score (0-100) calculated from the latest data packet. It starts at 100 and penalizes the line for delays, irregular gaps (headways), and missing trains. A higher score means a healthier, more predictable service.
Trips & Total Stops (Yesterday)
These metrics show the total volume of service provided in the last 24-hour cycle. Trips indicates the number of completed train runs from start to finish. Total Stops counts every single station stop made by all trains combined.
30-Day Trend Table
This table visualizes the line's performance history over the last month.
Reliability: The average daily health score.
On-Time Percentage (OTP): The percentage of trains that arrived within 5 minutes of their schedule.
Hourly Delays Table
A breakdown of performance hour-by-hour for the current day. It helps identify exactly when service disruptions occurred (e.g., during morning rush hour) versus when the line was running smoothly.
What does "~Avg" mean?
This represents the Average Estimated Wait Time (Headway) for a train on this line right now. It is calculated based on the current physical distance between active trains.
Active Trains Count train
The number displayed next to the train icon represents the total count of trains currently in service and transmitting data on this specific line.
Top Delays by Station
This list highlights specific stations where passengers are currently experiencing the longest wait times. It helps identify localized bottlenecks or incidents affecting specific parts of the route.
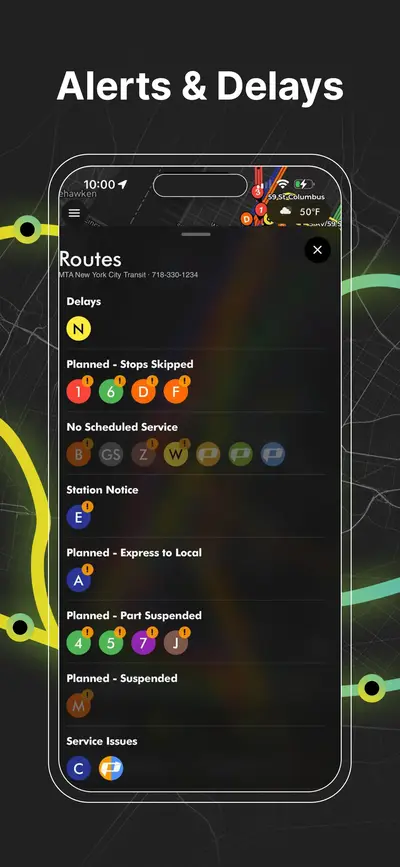
Service Status Definitions
We categorize real-time line health into three tiers based on the Reliability Score:
Good Service (90-100):
Trains are running smoothly with minimal delays or gaps.
Unstable Service (50-89):
Minor delays, irregular headways, or congestion detected.
Bad Service (< 50):
Severe delays, major incidents, large gaps between trains, or service suspension.

Download App
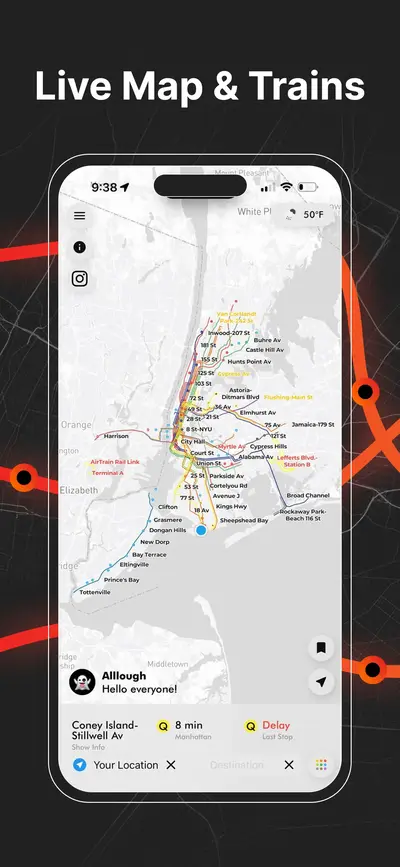
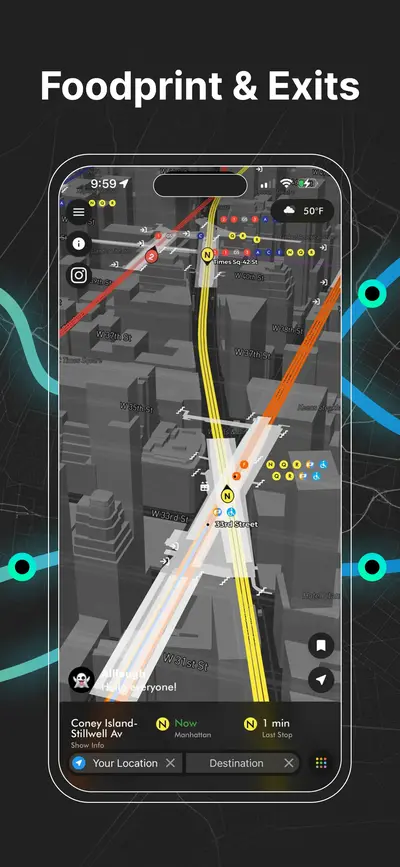
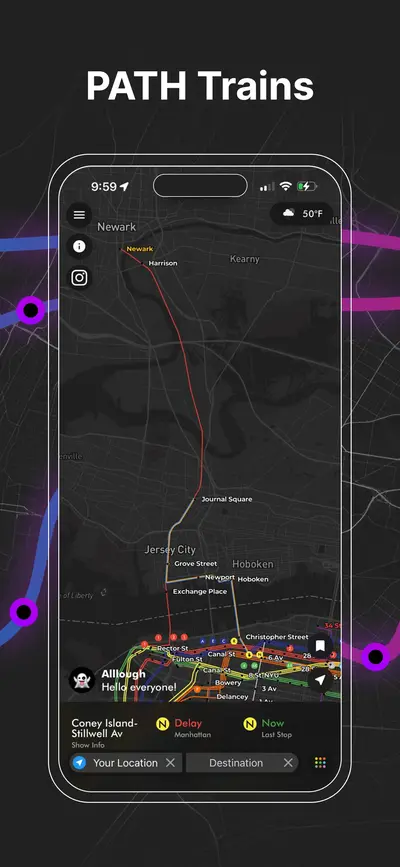
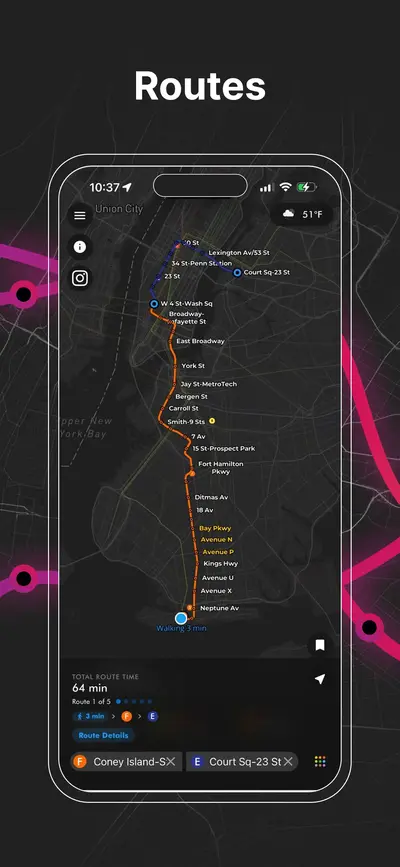
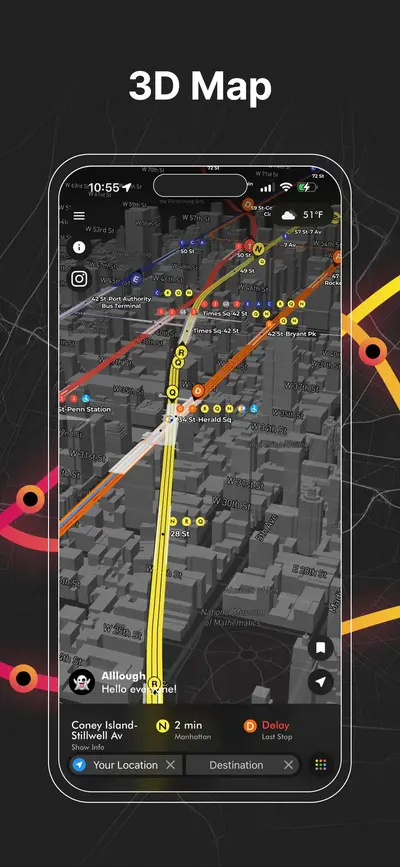
Real-time NYC subway, PATH, JFK AirTrain, route planning, station exits, transfer guidance, and service alerts in one map.

